Module 4: Data and calibration - basics

Eonomic data, Energy data & Hybridization

ThreeME team

OFCE, NEO

22 septembre 2023

startyear <- params$startyear
endyear <- params$endyear
scenario_to_analyse <- params$scenario_to_analyse
classification <- params$classification
template_default <- params$template_default
# Load functions
source("src/functions.R")
data_full<-readRDS(file = file.path("data","output", paste0(project_name,".rds")))

1 Introduction

Introduction

National accounts data

ThreeMe databases

Next steps

1.1 ThreeME databases

  • The calibration of ThreeME is based on a number of databases.

  • A Computable General Equilibrium (CGE) model is typically calibrated on a Supply Use Table (SUT) as this contains the economic transactions between agents including governments, sectors and households.

  • The ThreeME SUT is then combined with other national accounts data to close the household and government accounts.

  • Energy and emissions data in physical units are added to extend the SUT to an environmentally extended SUT (EE-SUT).

  • Finally, additional data are used to increase the number of energy related products and sectors

  • Aim of this training: provide the basics on data and calibration

2 National accounts data

Introduction

National accounts data

ThreeMe databases

Next steps

2.1 Generalities on national accounts

  • National accounts are a system of accounts and balance sheets that provide a broad and integrated framework to describe an economy, whether a region, a country, or a group of countries

  • National accounts provide systematic and detailed economic data useful for economic analysis to support the development and monitoring of policy-making

  • National accounts record economic activities in a systematic manner, distinguishing actors belonging to institutional sectors such as households, corporations and government. The system describes the various transactions or other changes in assets or flows during a period of time as well as the level (normally at the end of a period of time) of stocks.

  • The System of National Accounts (SNA) is the internationally agreed standard set of recommendations on how to compile measures of economic activity. The SNA describes a coherent, consistent and integrated set of macroeconomic accounts in the context of a set of internationally agreed concepts, definitions, classifications and accounting rules( UNstat definition).

2.2 Supply and use tables (SUTs) : definition

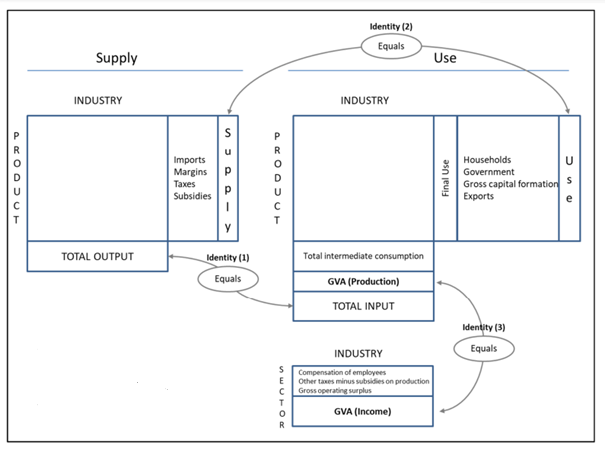
  • The supply and use framework is the part of the national accounts system which focuses on the production and use of goods and services in an economy. It reflects the activities of industries in which intermediate products and primary inputs (such as labour and capital) are required. Supply and use tables show where and how goods and services are produced and to which intermediate or final use they flow.

  • SUTs consists of two interlinked tables (UN stat division):

    Supply Table : describes how goods and services become available in an economy during a certain period of time. Products are either produced in the domestic industry or imported

    Use Table: shows how goods and services are used in the economy during a certain period of time. Products can be used either as intermediate consumption or as final use.

  • SUTs can be split into two tables: domestic and imported

2.3 Supply and use tables (SUTs) : main identities

  • Identity 1:

Output = Input

  • Identity 2:

Supply = Use Output + Imports= Intermediate consumption + Final consumption + capital formation + Exports

  • Identity 3:

GVA production = GVA income Output-Intermediate consumption = Compensation of employees + Gross operating surplus + Other taxes/subsidies on production

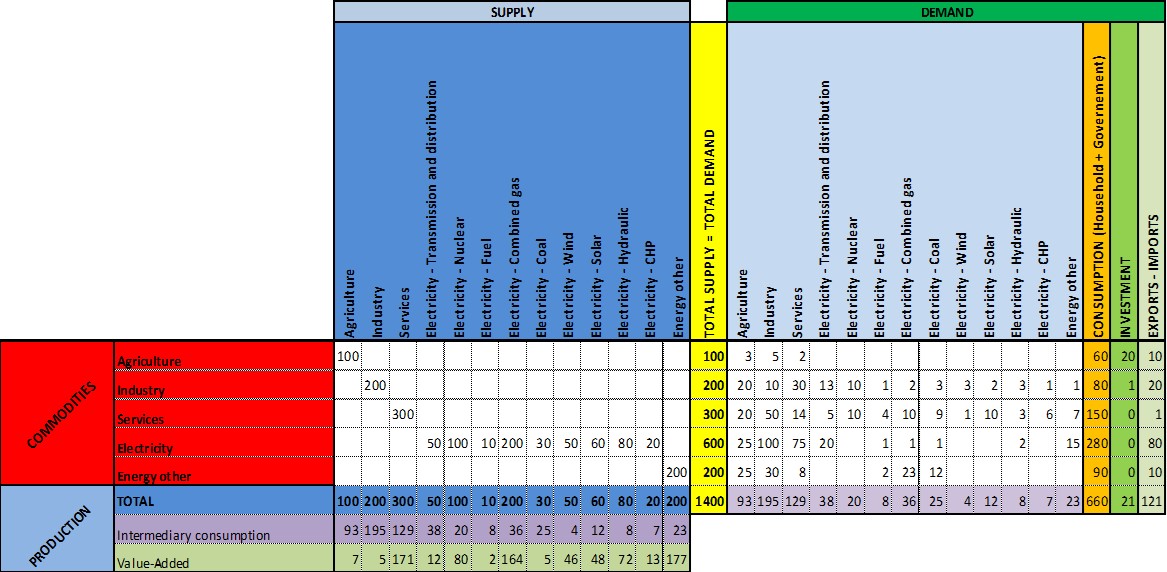
2.4 Simplified Supply Use and Input Output tables

  • SU table says how much a given commodities is supplied by a given sector (Supply)
  • IO table says how much a given commodities is purchased by a given sector (Demand)

3 ThreeMe databases

Introduction

National accounts data

ThreeMe databases

Next steps

3.1 Main characteristics of ThreeMe database

  • The ThreeME database is built from a number of databases, mainly from Eurostat.
  • These characteristics refer to the maximum level of detail possible in ThreeME.
  • The actual level of detail as applied in case studies can be lower as for each simulation in ThreeME, the database is aggregated to meet the needs of the research question at hand.

3.2 Main sources

  • The calibration of each Computable General Equilibrium (CGE) model starts with the SUT as this contains the economic transactions between agents such as governments, sectors and households.
  • The ThreeME SUT is combined with non-financial transactions data to capture the redistribution of incomes between households and government.
  • Energy Balances are used to create the full layer of energy supply and use in Mtoe, specified by product and sector. The same energy data in Mtoe is converted to euro in order to increase the number of energy products and sectors in the SUT.
  • GHG emissions in Mton are also included.
  • The number of transport sectors is increased to distinguish rail from road transport.
  • The investments matrix is estimated from Eurostat data.

3.3 Supply and use tables

  • SUT data complete only for France and the Netherlands, only available in basic prices for the EU27.
  • ThreeME assumes purchaser prices, thus product taxes and margins layers have to be estimated.
  • The only information available on product taxes is one row in the use table containing the total product taxes per sector.
  • Need to estimate total product taxes column per product in the supply table using the 2011 tax rates per product.
  • From this estimated column plus the available row in the use table, a RAS procedure is applied (well-known method for data reconciliation).
  • The initial matrix in the RAS is represented by the intermediate and final use matrix in basic prices. The result is an estimated tax layer by product and sector/final user.
  • The estimation of the margins layer follows a different approach as no historical data is available at EU level. Therefore, data from other countries is used instead.
  • The average 2015 margin rates by product and sector from twelve EU Member States (selected based on data availability) are used to gap fill the EU27 margin layer.

3.4 Physical energy SUT

  • The ThreeME physical energy layers are provided in Mton and have 20 energy products and 97 sectors (65 NACE sectors plus 28 energy sectors plus 4 transport sectors).
  • Physical energy layers are converted to monetary values by multiplying them with the IEA energy prices that are provided for industry and consumers excluding taxes (supply use) and including taxes (use table).
  • The physical energy data comes directly from the energy balances that provide physical energy data by 63 energy products, following the Standard International Energy Products Classification (SIEC), and 112 energy flows.
  • Energy balance data are based on the territory principle: they records the energy flows that occurred in a given country regardless the economic residence of the agent (consumer, energy and non-energy sectors).
  • The 63 SIEC products are aggregated into 20 energy products.
  • The 112 flows in the energy balances are mapped to the ThreeME variables (for example imports). Some flows are linked directly to the ThreeME variable, while others indicating a sector or technology are bridged to one of the 97 NACE sectors.

3.5 Correspondance between ThreeME variables and energy balance flows

3.6 Sectors and products desaggregation in ThreeMe

  • The electricity sector is further disaggregated to create 12 renewable and non-renewable electricity sectors. The disaggregation shares come from the output of electricity by type of energy source.

  • Distinction between transport diesel and heating gas oil: the product ’gas/diesel oil’ in the energy balance is split into ’transport diesel’ and ’heating and other gas oil’ based on commodity balances data (these are similar to energy balances but focus on the supply and use of a product rather than transformation efficiencies).

  • Correction for nuclear heat which is set to zero.

  • The sector ’H49 - Land transport and transport via pipelines’ from the SUT data is disaggregated into the following five sectors (using Eurostat Structural Business Statistics):
    H491: Passenger rail transport, interurban
    H492: Freight rail transport
    H493: Other passenger land transport
    H494: Freight transport by road and removal services
    H495: Transport via pipeline

3.7 Investment matrix

  • In the SUTs, the investments or Gross Fixed Capital Formation (GFCF) are provided by product in one column from the use table. But ThreeME requires the investments also by sector.

  • Need to create an investments matrix by product and sector.

  • Eurostat supplies GFCF flows by NACE sector and by asset. This data is assumed to represent the investment matrix.

  • Assets first have to be bridged to CPA2008 products to match the SUT classification and the total sum of this matrix should equal the total sum of investments in the use table. A RAS procedure is applied.

  • RAS procedure applied only for France and Netherlands as GFCF data for the EU is missing.

  • For the EU27, the intermediate use matrix is used instead of the GCFC matrix: investment matrix per product and sector is calculated by applying proportionate shares of the intermediate consumption on the investments per product

3.8 Emissions

  • In ThreeME the emissions extensions are not only provided at sectoral level, type of fuel and source sector.
  • Use of two databases from Eurostat: air emissions accounts : Leading database for ThreeME, fully consistent with the System of National Accounts (SNA) and thus the SUTs.
    air emissions inventories:Follow international conventions such as the UNFCCC, used also in ThreeME because of detailed information on the sources sectors that are aggregated in 3 sources (combustion, production and material related emissions).
  • The distinction of the emissions by type of fuel is made using the information from the physical energy use table in Mtoe that is converted from Mtoe to Joules using IEA (2005) heat values and from Joules to emissions in tonnes using IPCC (2006) emission factors.

3.9 Redistribution of income

  • Household and government accounts are added to create the fourth quadrant of the Social Accounting Matrix, including property income, social benefits, employer social contributions and transfers.
  • Data is used from the Eurostat non-financial transactions.

4 Next steps

Introduction

National accounts data

ThreeMe databases

Next steps