variable_macro <- c( "Y", "CH", "I", "G")
label_macro <- c("GDP", "Households consumption", "Investment", "Public spending")

A <- simpleplot(data_full,variable_macro, label_macro, startyear, endyear,  transformation = "reldiff", titleplot = " GDP and its components, ref susbstitution
(in relative difference from baseline)",
           unit = "percent", decimal = 0.1 ,scenario = "shock_g_0.5_tra", name_baseline = "baseline_0.5_tra")  + theme(text = element_text(size = 9))

B <- simpleplot(data_full,variable_macro, label_macro, startyear, endyear,  transformation = "reldiff", titleplot = " GDP and its components, low substitution
(in relative difference from baseline)",
           unit = "percent", decimal = 0.1 ,scenario = "shock_g_0.1_tra", name_baseline = "baseline_0.1_tra")  + theme(text = element_text(size = 9))


macro <- ggarrange(A,B,
labels = c("(a)", "(b)"),
hjust = -0.5, vjust = 1.5,
ncol = 2, nrow = 1,
widths = 2,  heights = 1)

macroSensitivity Shock G
ThreeME team
OFCE, NEO
22 septembre 2023
1 Sensitivity analysis
Sensitivity analysis
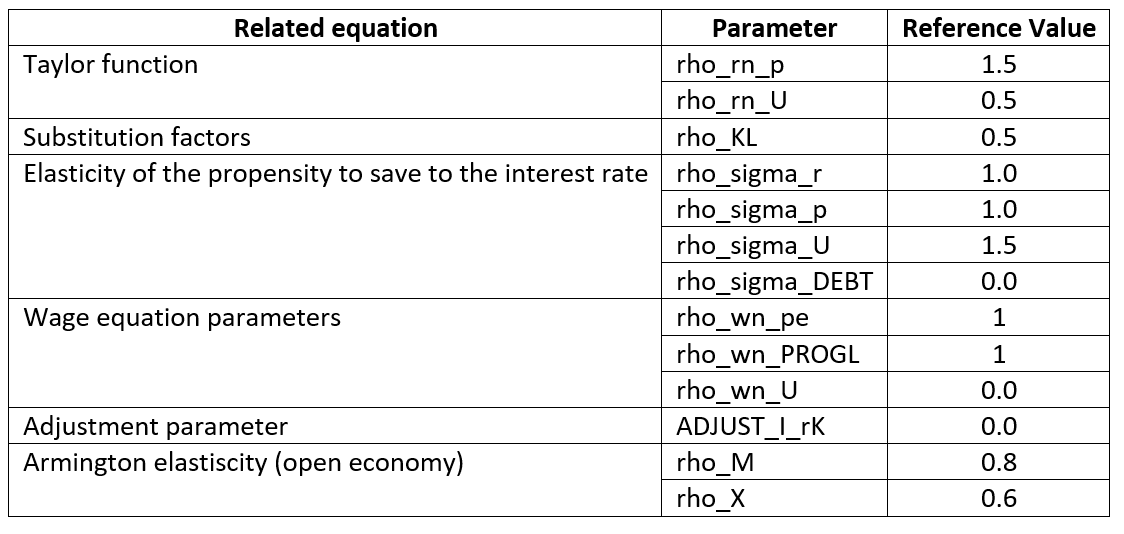
1.1 Reference values
1.2 Simulation results
variable_macro <- c( "Y", "CH", "I", "G")
label_macro <- c("GDP", "Households consumption", "Investment", "Public spending")

A <- simpleplot(data_full,variable_macro, label_macro, startyear, endyear,  transformation = "diff", titleplot = " GDP and its components, ref elasticity
(in relative difference from baseline)",
           unit = "percent", decimal = 0.1 ,scenario = "shock_g_1_0_tra", name_baseline = "baseline_1_0_tra")  + theme(text = element_text(size = 9))

B <- simpleplot(data_full,variable_macro, label_macro, startyear, endyear,  transformation = "diff", titleplot = " GDP and its components, high elasticity
(in relative difference from baseline)",
           unit = "percent", decimal = 0.1 ,scenario = "shock_g_100_100_tra", name_baseline = "baseline_100_100_tra")  + theme(text = element_text(size = 9))

macro <- ggarrange(A,B,
labels = c("(a)", "(b)"),
hjust = -0.5, vjust = 1.5,
ncol = 2, nrow = 1,
widths = 2,  heights = 1)

macro